What 15 Million Reviews Reveal About Incentivised Reviews
Ratings & Reviews


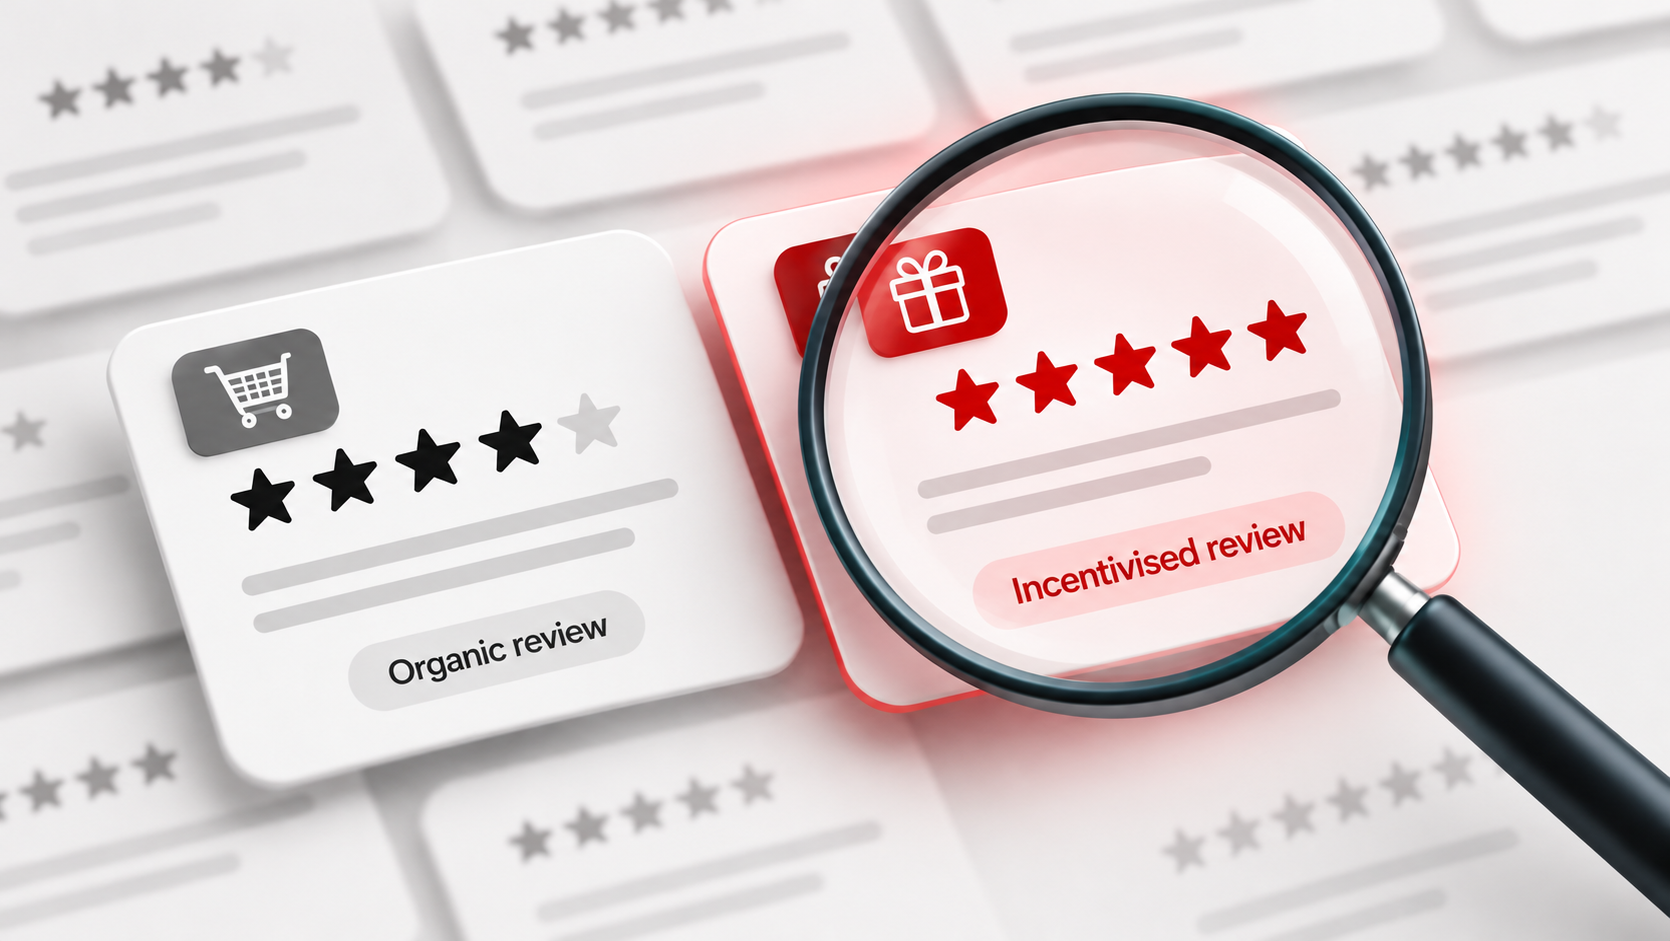

Across 15.3 million reviews, about 1 in 14 (7.3%) was written in exchange for something. Most top products run several waves of incentivised reviews, lifting review volume by anywhere from 8% to more than 500% in the months the waves run. These reviews rate higher in every category we looked at, and the number of complaints they contain varies by category.
An incentivised review is one the reviewer was rewarded for writing. The reward is usually a free product, but it can also be a coupon, loyalty points or a sweepstakes entry (Bazaarvoice). What makes the practice legitimate is that the reward does not depend on the opinion, and the review is labelled as incentivised.
Brands use these programmes for three reasons:
• Seeding new products. A launch with zero reviews converts poorly, so brands send samples to get the first ratings on the page.
• Filling gaps. Retailers, markets or products with few reviews get a boost in volume.
• Getting detailed feedback early. Sampled reviewers tend to use the product deliberately and describe it at length.
The main programme types:
• Marketplace programmes. Marketplace programmes, such as Amazon Vine and Walmart SparkReviewer, invite trusted reviewers to pick free products to review. The review scarry a badge, and sellers cannot choose or contact the reviewers.
• Brand sampling through review platforms. which run sampling campaigns for brands, flag each resulting review as incentivised and syndicate it to the brand’s site and partner retailers.
However, the rules are getting stricter. In August 2024 the US Federal Trade Commission finalised a rule that bans rewards conditioned on a review being positive or negative, whether stated or implied.
The analysis ran on Wonderflow’s data lake and covered 15.3 million ratings and reviews published between January 2023 and October 2026. It spans 6 macro categories, more than 55 countries and more than 150 online retailers, marketplaces and brand sites.
Definition: A review counts as incentivised when the retailer or review platform marks it as incentivised, or when AI detects that it is. Spotting those unlabelled cases at this scale is where ai for customer review analysis comes in.
Measures: We measured the share of incentivised reviews by year, country and channel. We then compared incentivised and non-incentivised reviews on three KPIs:
• Star rating.
• Sentiment index: −1 (fully negative) to +1 (fully positive).
• TGW ("things gone wrong"): which is the average number of complaints mentioned per review.

In every category, incentivised reviews have a higher star rating and a higher sentiment index.
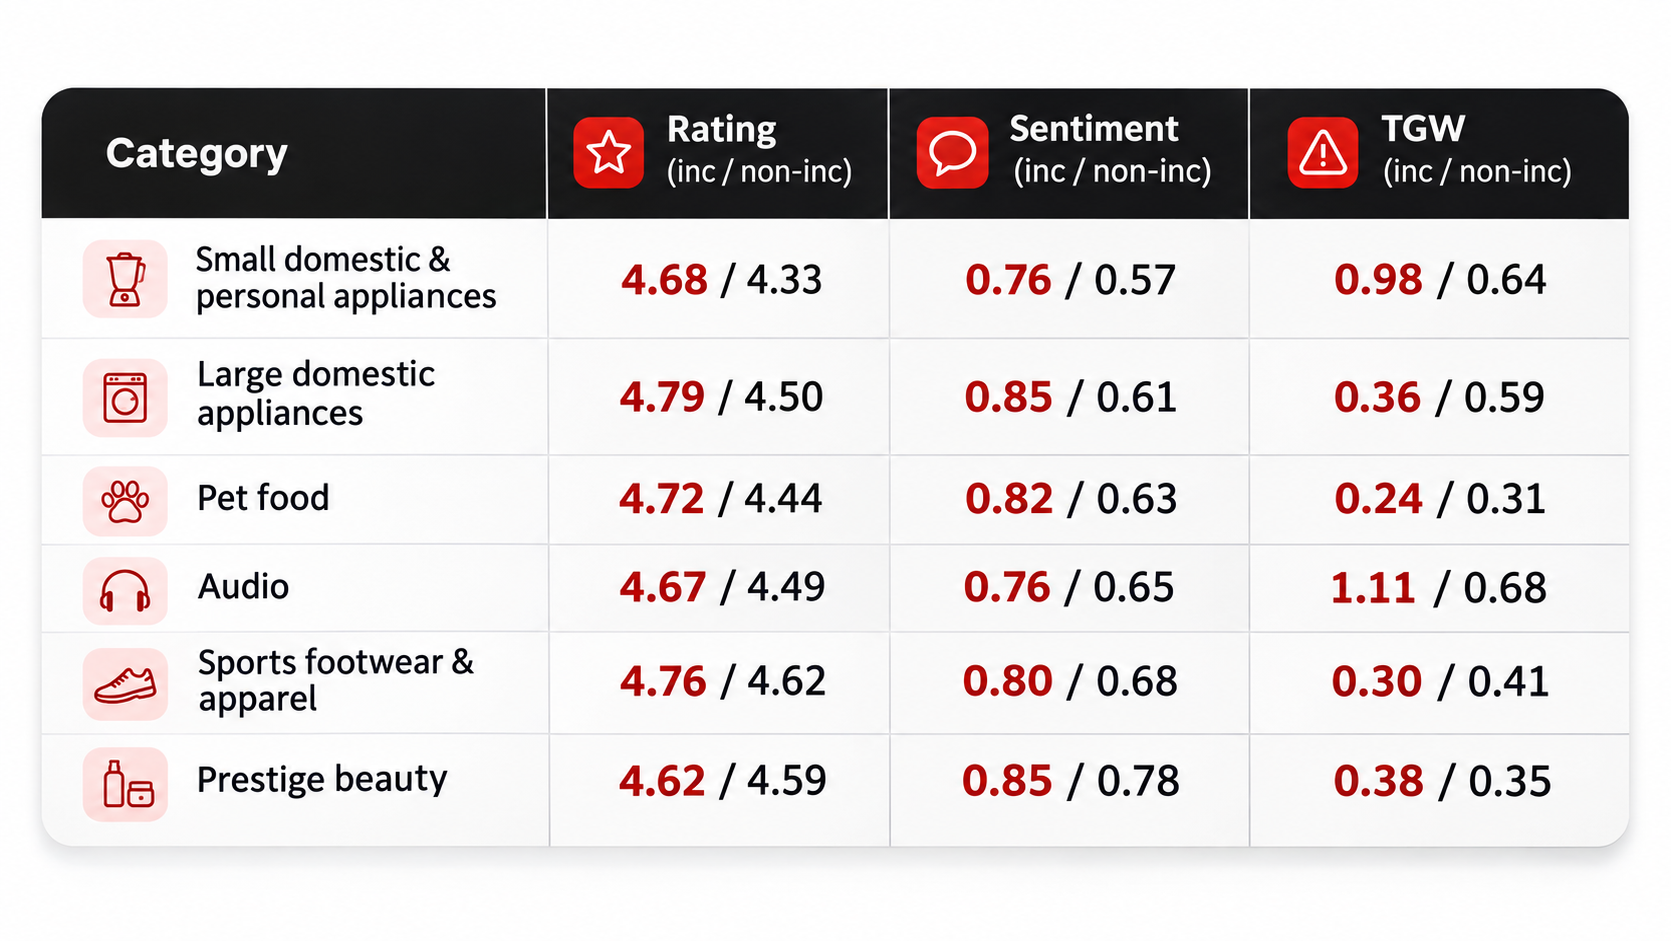
The rating gap ranges from +0.03 to +0.34stars, and two patterns explain most of it:
• The gap is widest where everyday ratings are low. Small domestic & personal appliances have the lowest organic rating (4.33) and the widest gap(+0.34). Within that category, single catalogues reach almost a full star(+0.94 for professional headsets).
• The gap is narrowest where incentivised reviews are common. In prestige beauty, where 24% of reviews are incentivised, the gap shrinks to 0.03 stars.When so many reviews come from sampling, the “organic” baseline is shaped by the same programmes.
TGW doesn't follow rating. Incentivised reviews have a higher TGW in 3 of the 6 categories and a lower one in the other 3. The gap is largest in technology products:
• Audio: 1.11 complaints per incentivised review vs 0.68, despite a rating of 4.67 vs 4.49.
• Small domestic &personal appliances: 0.98 vs 0.64. Robot vacuums double up: 2.30 vs 1.12.
Incentivised reviewers write longer, more considered reviews. They test the product on purpose, so they give a high overall score and still list the small things that bother them: a short cable,a noisy setting, a fiddly app. In grooming, reviews our AI flagged asincentivised complain most of all (1.23 vs 0.83 for retailer-flagged ones).
For simpler or consumable products, namely pet food, footwear and major appliances, the picture flips, and incentivised reviews log fewer complaints than the rest. Tracking sentiment and complaintcounts side by side is the kind of work a customer feedback analysis tool handles across millions of reviews.
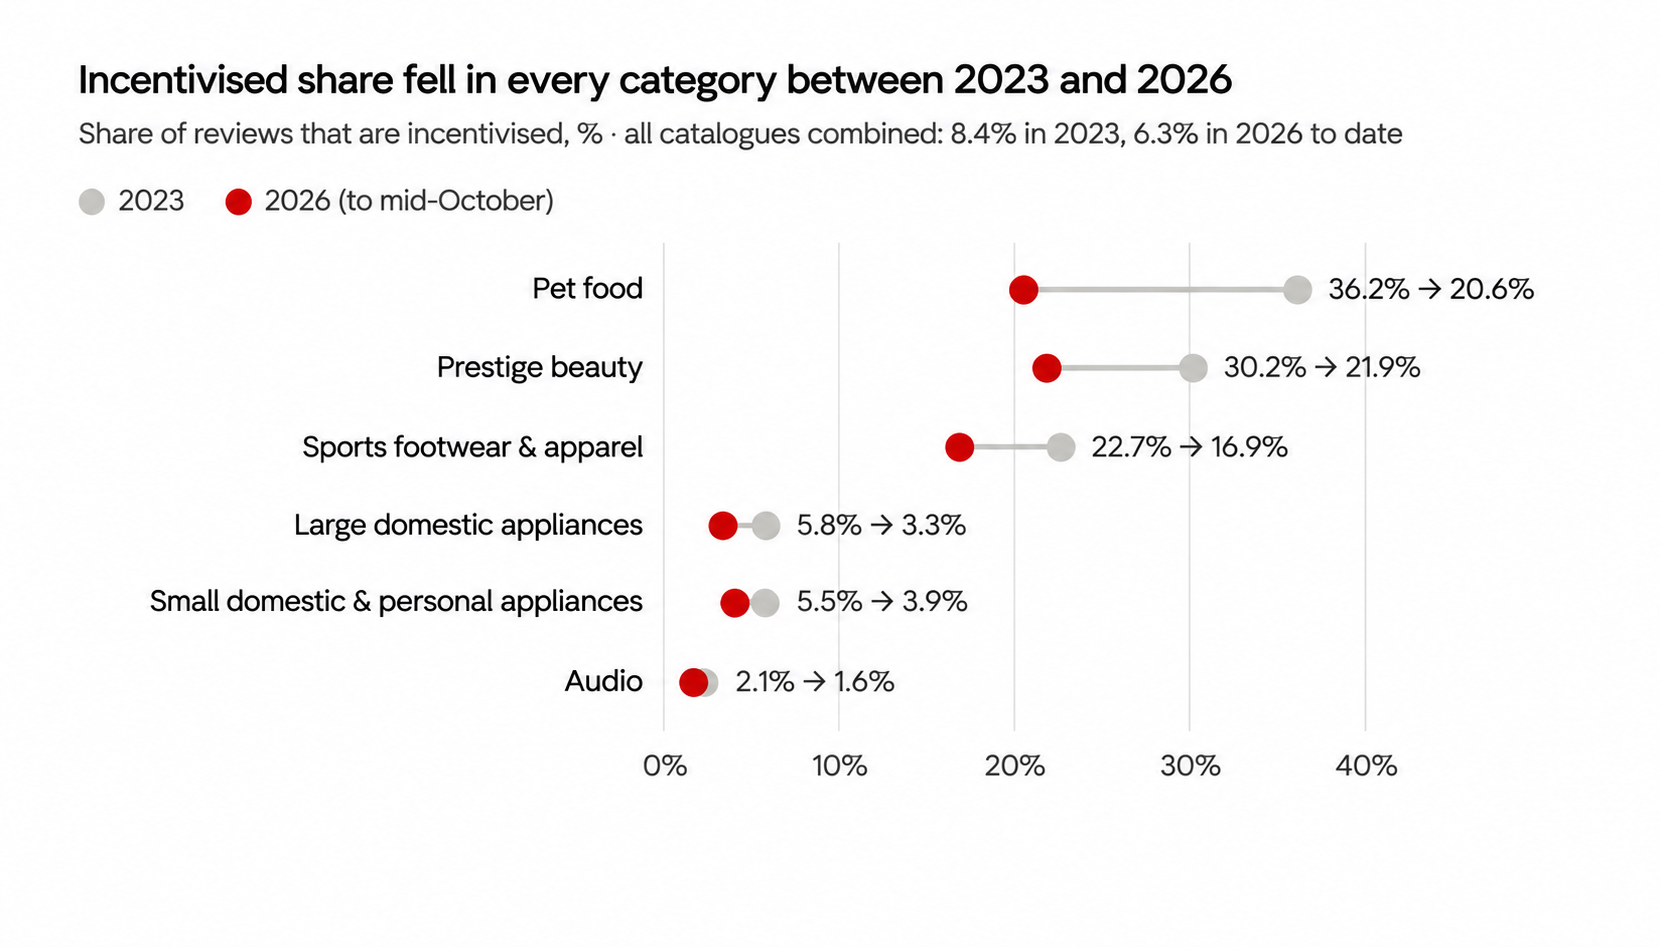
The incentivised share ranges from 2.4% inaudio to 30.7% in pet food. Electronics and appliances all sit at or below about 5%. The heavy users are categories where trying the product is whatconvinces people: pet food, prestige beauty and sports footwear. In pet treats,more than two-thirds of reviews are incentivised.
Every category has a lower incentivised share so far in 2026 than in 2023, and in five of the six, 2026 is the lowest year of the four. Pet food fell furthest, from 36% to 21%.
Two things are likely behind it:
• Stricter rules. The FTC rule finalised in August 2024 made brands more careful with sampling programmes.
• Faster organic growth. Organic review volume is growing faster than sampling, and robot vacuum reviews grew sevenfold between 2023 and 2026 while incentivised reviews barely doubled.
The same review is often shown on many retailer sites, so incentivised reviews get more exposure than their share suggests. In prestige beauty, each incentivised review was counted 2.6 times across countries, which means a shopper is more likely to see one than the 24%share implies. Seeing how the same review travels across retailers is a natural use of ecommerce consumer insights.
Of the products launched after January2023, 87% had incentivised reviews within their first 3 months. In five of the6 categories, every launch we could check did. However, the launch push is only one use; the bigger one is topping up volume on established products.
62% of analysed products had more than one incentivised peak since 2023. Another 35% had a single peak, and few products had a steady flow with no distinct peak. Two patterns show up:
• Campaigns: Separate pushes, often repeated each year, with little or nothing in between. Examples include a pet-food range sampled every February to April, or a floor-care product with four distinct waves.
• Always-on: With incentivised reviews almost every month and bigger spikes from Black Friday to January and in spring. This is the norm in beauty, sportswear, kitchen and personal-care catalogues.
The median catalogue gets about 20% more reviews in months with incentivised reviews:

The uplift depends mostly on how manyreviews a product gets on its own, much more than on its category.
• Low organic base: Products with few organic reviews see huge jumps. A small-dog wetfood went from about 3 reviews a month to 48 in campaign months (more than+1,500%). A cordless vacuum went from about 26 to 210 (roughly +700%).
• High organic base: Bestsellers barely move. A multi-cooker with 500 to 1,000 organic reviews a month gained only 5%, and a range of steam irons showed no measurable uplift. The same campaign size can mean 5% for one product and 1,000% for another. Incentivised reviews change the picture most for niche, newly launched or slow-selling products, and they become close to invisible for bestsellers.
• Separate incentivised reviews before you benchmark : Ratings can be inflated by up to almost a full star, and a retailer or market with heavy sampling will look better than an organic-heavy marketplace for that reason alone. Compare like with like.
• Read volume with care : Where incentivised reviews make up most of thevolume during campaigns, growth reflects the review programme and says littleabout demand. Track organic volume on its own for a cleaner signal.
• Set expectations by organic base: The uplift can be forecast from a product’s organic review rate before a campaign runs. Low-base products gain the most, and bestsellers barely move.
• Plan campaigns as a calendar: Most brands already re-run campaigns aroundlaunches, Black Friday and spring. Treating this as a planned calendar matcheshow the leading catalogues already work.
• Expect less sampling-driven volume: With incentivised shares falling in everycategory, brands that counted on sampling need organic review generation too,such as post-purchase requests and better product content.
• Read incentivised reviews for detail as well as stars: In technology categories they list far more issues than organic reviews. The minor defects sampled users notice today are tomorrow’s one-star reviews.
• Check beyond retailer labels: Many marketplaces never flag incentivisedcontent, so it hides in the organic pool. AI detection closes that gap: on onemarketplace it surfaced 36% of reviews as incentivised where the platformshowed none. A voice of customer platform with this kind of detection built in keeps your benchmarks clean.
• Mind where syndication takes your reviews: One sampled review can appear on a dozenretailer sites. Make sure the incentive is disclosed everywhere it shows up, asthe FTC rule and retailer policies require.
• Use the TGW gap as a quality check on your programme: If incentivised reviews complain much less than organic ones, the sampled audience may be too friendly to be representative. If they complain about different things, the samples may not reflect real use.
Wonderflow helps leading consumer brands transform unstructured feedback into actionable insights. Its AI Product Intelligence platform analyzes millions of online ratings, reviews, surveys, and customer comments, empowering teams to make smarter product, marketing, and customer experience decisions.


The AI platform that transforms customer feedback into actionable insights