How Do You Determine Willingness to Pay Using Customer Insights?
Consumer Insights



Price is one of the biggest decisions in any launch, and customers talk about it all the time. They mention it in reviews after they buy and in forum threads while they are still deciding. That constant conversation makes customer feedback a useful source for understanding how price is perceived in a category.
Voice of customer data will not tell you whether the right price is $3.89 or $3.99. Customers do not write reviews that name what they would pay down to the cent. Price elasticity studies exist for that, and they are the better tool once you need that precision. What feedback can do is show you how price is perceived across a market, which is a strong starting point for positioning and for deciding what to test formally.
There are two elements to capture, and they work best together.
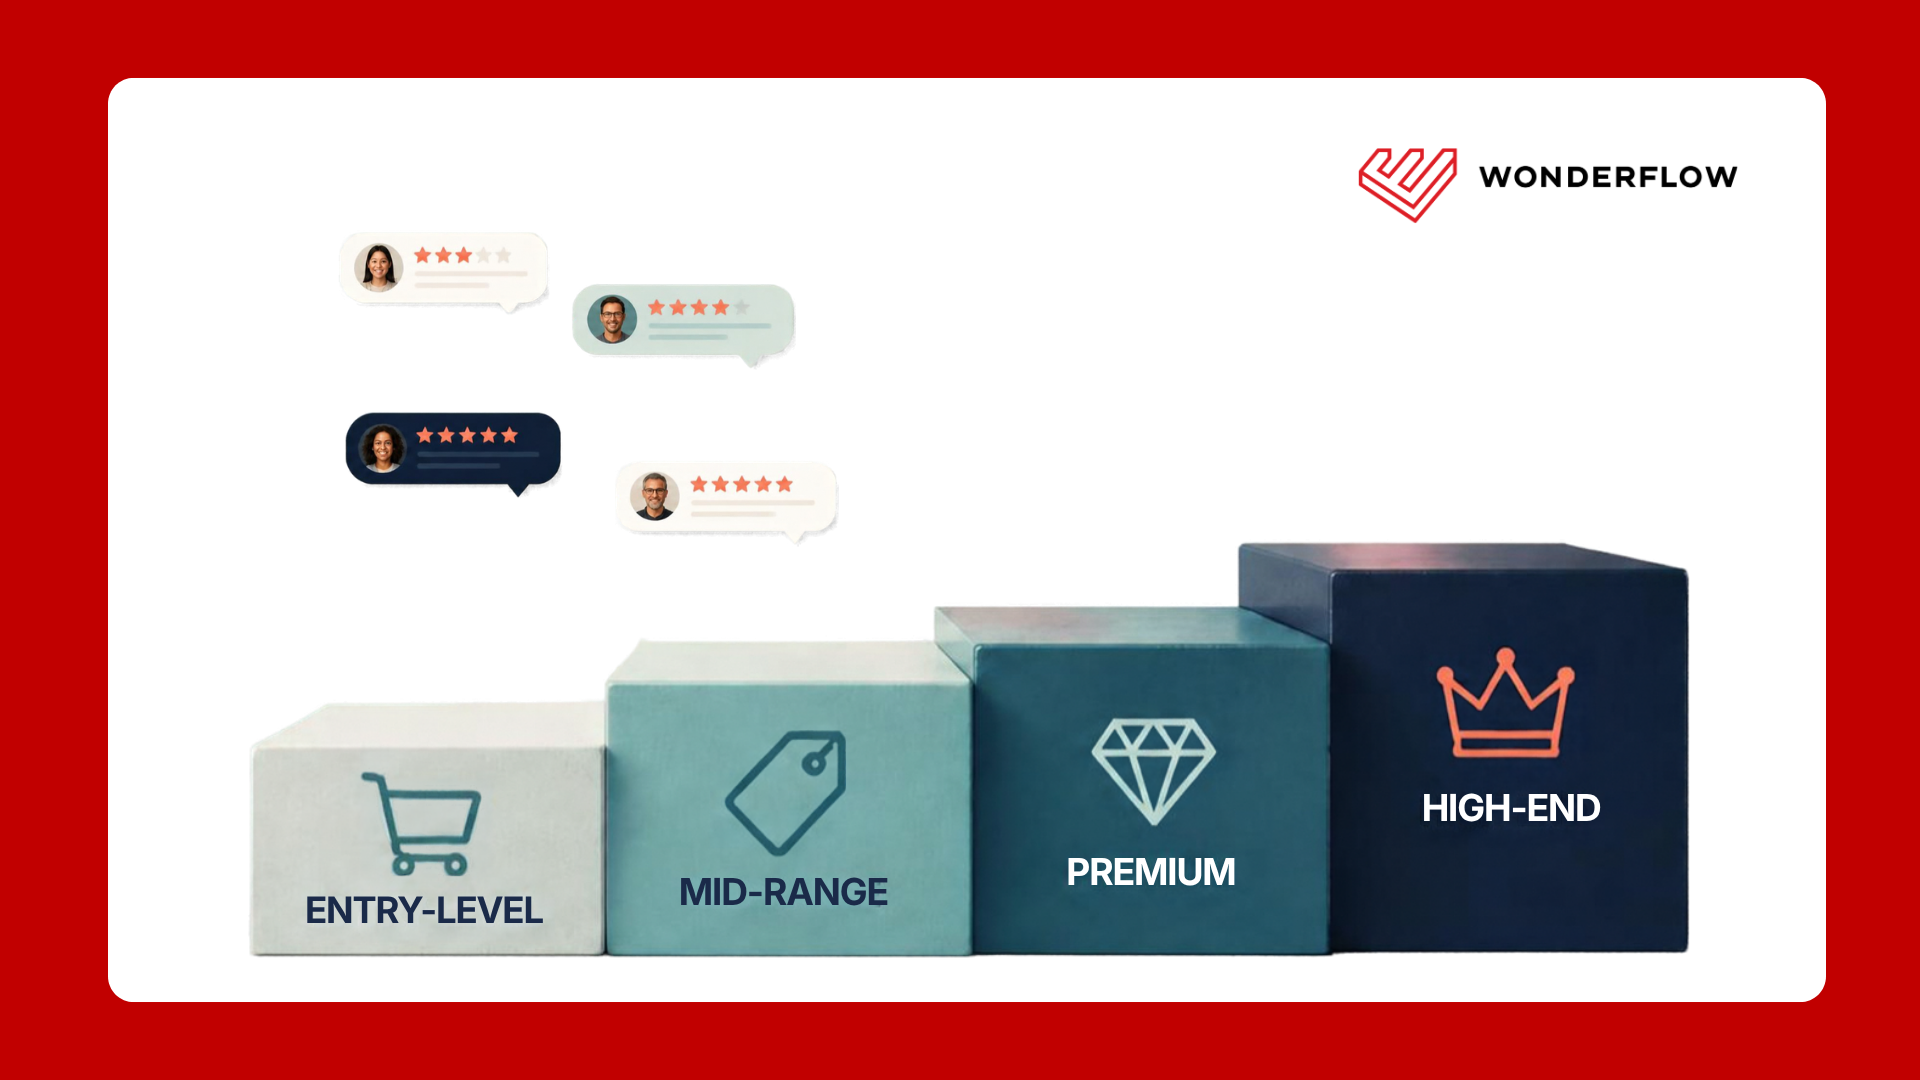
The first is the actual price. On retailer websites, each product carries a price tag, and those figures can be collected for every product in a category. With them you can group products into tiers such as entry-level, mid-range, premium and high-end. Those tiers need to be defined for each category, since a dishwasher and a toothbrush sit on very different scales. What counts as premium in one category may be an entry price in another. Pulling live price points from each listing is a natural fit for ecommerce consumer insights, which connect the price tag to the reviews written on that same page.
The second is what customers say about price. Read two comments on the same microwave. One reviewer says the price is perfect. Another says it is far too expensive for a simple microwave. The price tag was identical for both. What differed was perception, and perception depends on many things: expectations, purchasing power and whether the product worked well. A buyer who received a defective unit will judge the same price far more harshly than one whose unit performed as promised.
Since price perception is subjective, comments about price are essential. The tag gives you the number, and the comments tell you how that number feels to the people paying it.
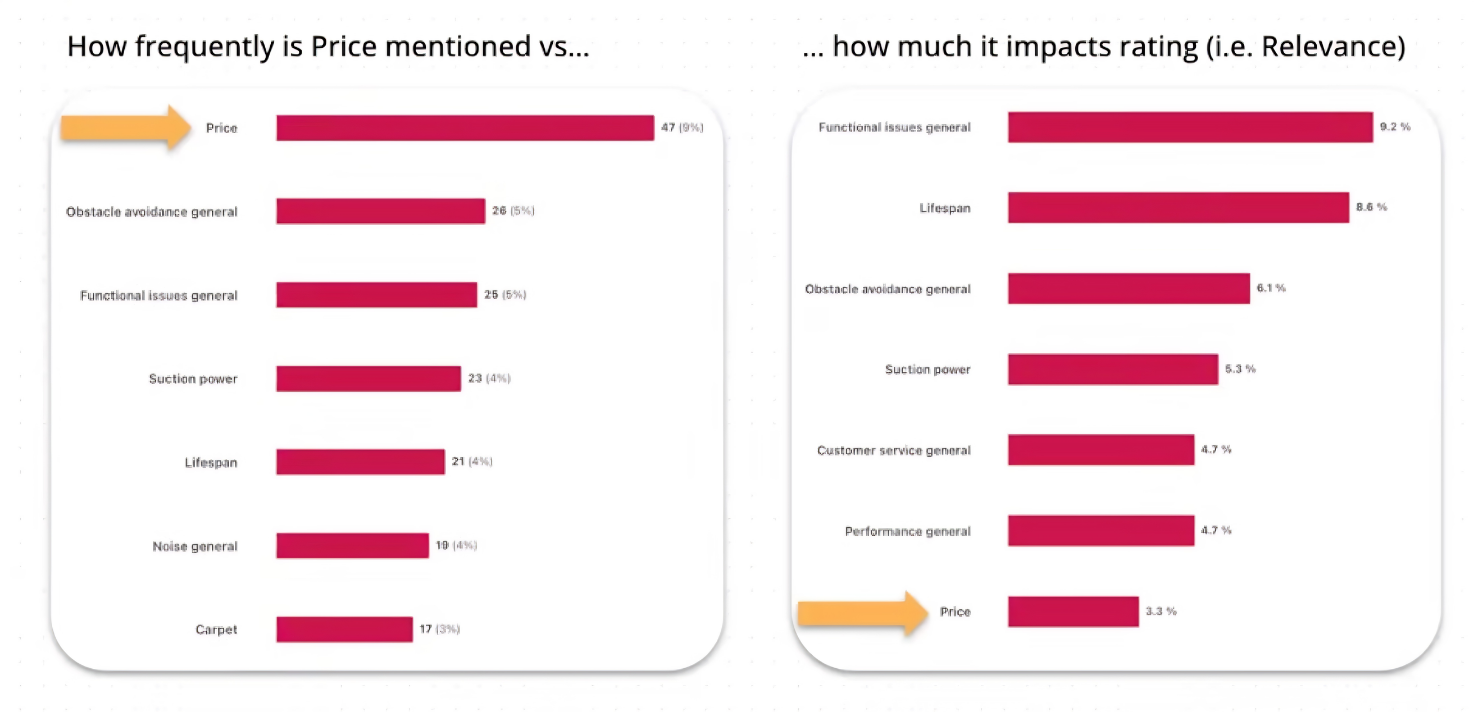
Take one product where price is the most common negative topic. Around 10 percent of reviewers describe it as high. That looks alarming. But when you check how much each topic influences the final star rating, price falls well down the list.
The reason is that many buyers accept a high price when the product meets or exceeds their expectations. They mention it and move on, and their rating reflects satisfaction with the product. If you had looked only at the count of mentions, you might have concluded that price was hurting the product and cut it, when the evidence says buyers are willing to pay it. Customer feedback analytics software shows both the volume of a topic and its impact on ratings, which is what makes this comparison possible.
You can run the same comparison by tier to see whether price sensitivity differs between entry-level and premium products. In some categories, shoppers at the low end care intensely about price. In others, premium buyers are surprisingly quick to call something overpriced when it disappoints.
Another useful view puts the average selling price alongside how customers describe value for money. Comments range from "not worth it, too expensive" to "worth every penny." Two brands can have almost the same average selling price and produce completely different value perceptions. Several things drive the gap, including product performance, brand positioning and specific features.
For a launch team, this comparison is revealing. It shows where buyers feel a price is justified and where they feel let down, and it tells you how much room you have to charge at a given level.
Suppose you plan to launch within a specific price range. You can pull every product in that band and look at what customers say about their prices. Which products earn the best value-for-money comments, and which get the worst? Are there features that customers appreciate in that range, such as a longer warranty, better materials or a particular function? Answers to those questions tell you what buyers expect for their money and what would make your product feel like a good deal.
Retail teams do this kind of band analysis all the time, and the best consumer insights platform for retail makes it easier by grouping products by price tier and layering customer comments on top.
A practical approach looks like this. Choose the tier you intend to launch in. Collect the products in it and their prices. Look at how customers talk about price and value for those products. Identify the features linked to strong value perception. Then use what you learn to position your product and to decide which pricing questions deserve a formal study.
Doing this manually across many products would be slow, which is why tools that connect price data with review topics matter. Platforms for customer review analytics bring the tiers, the comments and the value perception into one view.
No single analysis will hand you the perfect price. The combination of price tags, price comments and value-for-money perception, though, gives you a well-grounded view of the market you are about to enter.
Wonderflow helps leading consumer brands transform unstructured feedback into actionable insights. Its AI Product Intelligence platform analyzes millions of online ratings, reviews, surveys, and customer comments, empowering teams to make smarter product, marketing, and customer experience decisions.
The AI platform that transforms customer feedback into actionable insights